[LLM Sponsor Detection Benchmark]
May 26, 2026
Cutio uses LLMs to detect sponsor segments in YouTube videos in real-time. Model choice directly affects user experience: a false positive skips actual content, a false negative forces the user to sit through an ad. We need models that are accurate, fast, cheap, and reliable — but these goals are in tension. This benchmark evaluates 6 models on detecting and classifying sponsored and self-promotional segments across 65 videos spanning diverse categories and creators, quantifying the trade-offs.
The task is harder than it looks. Sponsors are often weaved into content naturally (stealth integration), creators do meta-commentary about their own ads, and self-promo segments can look identical to sponsored reads. Ground truth is built via multi-model consensus from three frontier LLMs with judge arbitration — the prompt encodes a decision tree that forces models to reason about context before classifying.
> Multi-Model Consensus Ground Truth
Building reliable ground truth for ad-segment detection is hard — human annotation is expensive, slow, and subjective. We use a multi-model consensus protocol that combines three frontier-class LLMs as independent annotators with a fourth model as a tiebreaker judge.
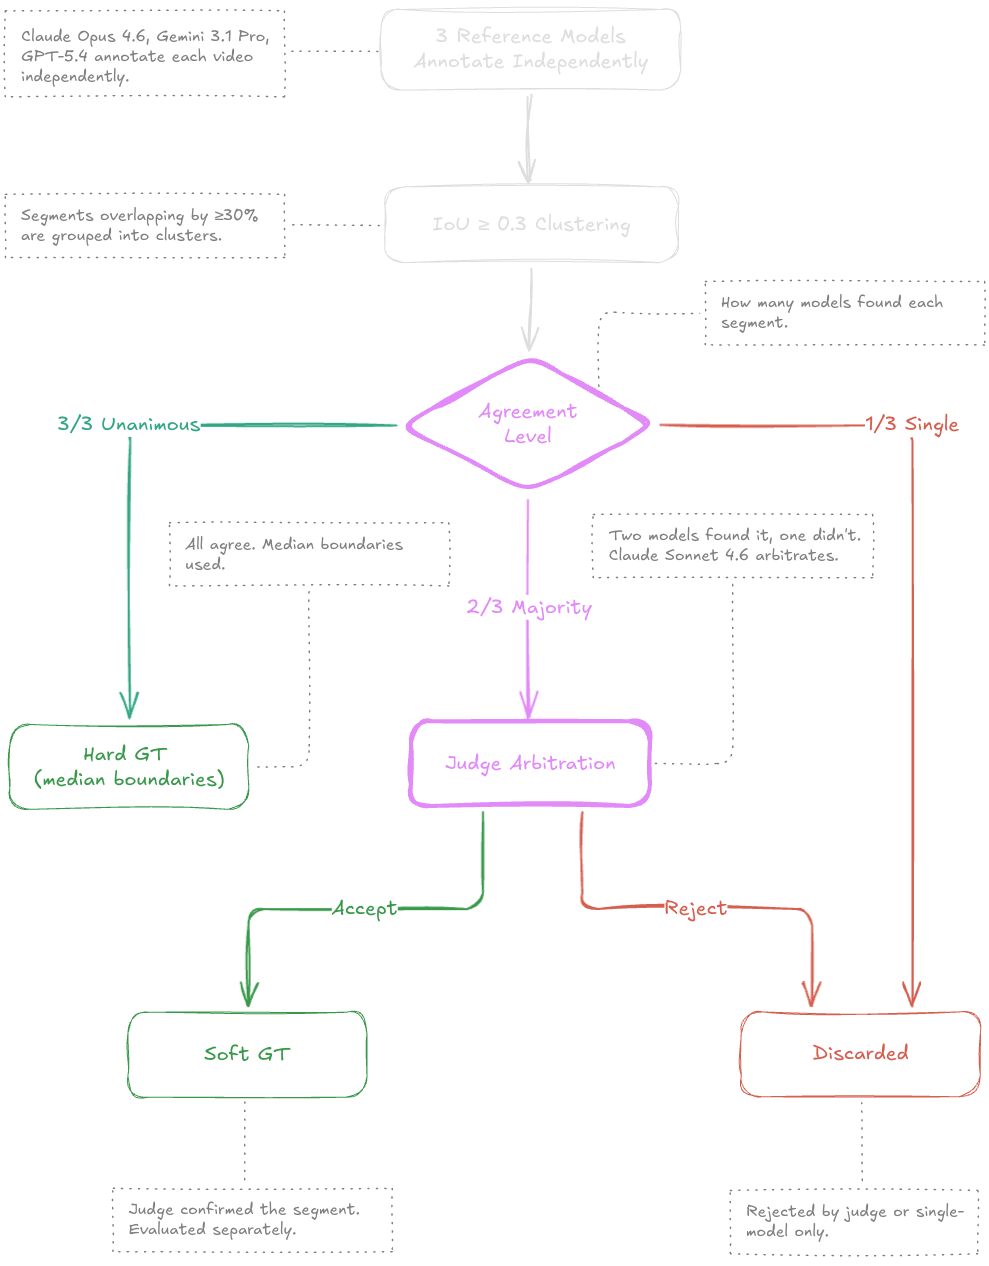
Reference models: Claude Opus 4.6, Gemini 3.1 Pro, and GPT-5.4 annotate every video independently with extended thinking enabled. Overlapping segments are clustered across models using IoU ≥ 0.3.
Tiered confidence: Segments where all three models agree become hard ground truth (median boundaries). Where only a majority agrees, Claude Sonnet 4.6 acts as a blind judge — receiving the transcript fragment and anonymized annotations without knowing which model produced which. The judge's verdict becomes soft ground truth. Single-model detections are discarded.
Inter-annotator agreement measured via Krippendorff's alpha reaches α = 0.857 — well above the 0.8 threshold typically considered reliable. 19 segment clusters were disputed and discarded.
Total segments
96
Hard (unanimous)
88
Soft (judged)
8
Krippendorff's α
0.857
> Prompt Design
Each model receives the same structured prompt: video metadata (author, title, category, description, duration) plus the full timestamped transcript. The prompt encodes a decision tree that forces sequential reasoning:
- • Q1. Is this promotional language sincere? → ironic / skit → skip
- • Q2. Does the video exist for this purpose? → primary topic → skip
- • Q3. Third-party brand + CTA? → sponsor
- • Q4. Creator's own stuff in >5s block? → self-promo
The output is structured JSON validated with Zod — segment start/end in integer seconds with category classification. An Anthropic-specific workaround removes minimum constraints from the schema (Claude rejects them), then re-validates locally with the strict schema.
> Evaluation Protocol
Matching: Predicted segments are matched to ground truth using greedy IoU-based assignment. All candidate pairs with IoU ≥ 0.5 are sorted by IoU descending; the best pair is matched first, then both segments are removed from further consideration. A match also requires correct category classification.
Metrics: F1 is micro-averaged across all videos. Timing accuracy is measured by MAE (Mean Absolute Error) of start and end boundaries for matched pairs. Mean IoU captures temporal overlap quality. Bootstrap confidence intervals (1000 iterations, block-resampled by video) provide uncertainty estimates.
Hard / Soft split: Metrics are reported separately for high-confidence (unanimous) and low-confidence (judge-arbitrated) segments, revealing how models perform on clear-cut versus ambiguous cases.
> Overall Ranking
The table below ranks models by F1 score with 95% bootstrap confidence intervals. Note that CI widths of ~12–16 pp mean differences between the top models are not statistically significant — treat relative rankings with caution.
| Model | F1 | F1 (hard) | Precision | Recall | Cost/Video | Latency (med) | MAE Start | MAE End | Mean IoU |
|---|---|---|---|---|---|---|---|---|---|
| gemini-3.1-flash-lite | 86.0% [79.6%–92.1%] | 88.0% | 88.9% | 83.3% | $0.0057 | 4.8s | 3.9s | 2.1s | 87.2% |
| gemini-3-flash | 85.7% [77.6%–92.4%] | 87.0% | 84.0% | 87.5% | $0.0077 | 2.9s | 2.9s | 2.0s | 89.0% |
| qwen-3.5-flash | 84.2% [76.6%–90.7%] | 86.0% | 88.5% | 80.2% | $0.0015 | 8.1s | 3.8s | 1.9s | 87.3% |
| qwen-3.6-flash | 83.8% [76.8%–90.2%] | 87.7% | 90.4% | 78.1% | $0.0047 | 7.1s | 4.8s | 1.6s | 88.4% |
| gpt-5.4-nano | 83.0% [76.6%–89.9%] | 83.4% | 79.8% | 86.5% | $0.0036 | 6.4s | 5.0s | 1.5s | 85.5% |
| claude-haiku-4.5 | 80.7% [72.2%–88.0%] | 83.7% | 85.9% | 76.0% | $0.0177 | 2.5s | 4.0s | 2.2s | 87.6% |
gemini-3.1-flash-lite ranks first overall at 86.0% F1 and first on hard segments at 88.0% hard F1. qwen-3.6-flash has the highest precision at 90.4%, while gemini-3-flash has the highest recall at 87.5%. qwen-3.5-flash is the cheapest model at $0.0015/video and the strongest F1-per-dollar pick at roughly 557; claude-haiku-4.5 is fastest by median latency at 2.5s.
> Detection Accuracy
F1 score captures the balance between precision and recall. Mean IoU shows how precisely predicted segment boundaries overlap with ground truth — a model can correctly detect a segment (high F1) while placing boundaries poorly (low IoU).
> F1 Score
Harmonic mean of precision and recall — the primary ranking metric.
> Precision vs Recall
Conservative models cluster top-left, aggressive ones bottom-right. Top-right is ideal.
The precision-recall scatter reveals distinct model strategies. Precision-biased models (upper-left) are conservative — they miss some sponsors but rarely make false claims. Recall-biased models (lower-right) catch more sponsors but produce more false positives.
qwen-3.6-flash lands on the conservative edge: it has the highest precision in the benchmark at 90.4%, but its lower recall keeps its overall F1 behind the top three models.
For a skip-ahead UX like Cutio's, high recall is critical — missed sponsors degrade the user experience more than occasional false skips, which users can easily undo. But precision below ~80% creates an annoyingly trigger-happy experience. The ideal operating point is the top-right corner: high in both dimensions.
> The Hard/Soft Gap
The hard/soft split shows a clear difficulty gap. Hard segments are solved well across models, while soft segments are noticeably harder because reference annotators disagreed and a judge had to arbitrate.
A structural factor amplifies this effect: because models don't distinguish "hard" from "soft" predictions, the soft slice is small and sensitive to a few matches. The metric captures genuine ambiguity, but should be treated as directional rather than a standalone production ranking.
| Model | Hard F1 | Soft F1 | Gap |
|---|---|---|---|
| gemini-3.1-flash-lite | 88.0% | 28.6% | 59.4pp |
| qwen-3.6-flash | 87.7% | 0.0% | 87.7pp |
| gemini-3-flash | 87.0% | 28.6% | 58.4pp |
| qwen-3.5-flash | 86.0% | 28.6% | 57.5pp |
| claude-haiku-4.5 | 83.7% | 9.5% | 74.2pp |
| gpt-5.4-nano | 83.4% | 29.4% | 54.0pp |
Hard F1 ranges from 83.4% to 88.0%, while soft F1 ranges from 0.0% to 29.4%. This suggests the benchmark's difficulty is tiered — clear-cut segments are solved well, but ambiguous edge cases remain much harder. The soft tier effectively measures a model's ability to handle content that even experts disagree on.
gemini-3.1-flash-lite leads hard F1 at 88.0%. gpt-5.4-nano leads soft F1 at 29.4%, with gemini-3.1-flash-lite, gemini-3-flash, and qwen-3.5-flash clustered close behind at 28.6%.
> Timing Accuracy
Beyond detection, where a model places segment boundaries matters. A correctly detected segment with sloppy boundaries creates a jarring skip experience. We measure MAE (Mean Absolute Error) for start and end timestamps separately.
| Model | MAE Start | MAE End | Ratio |
|---|---|---|---|
| gemini-3-flash | 2.9s | 2.0s | 1.5× |
| qwen-3.5-flash | 3.8s | 1.9s | 2.0× |
| gemini-3.1-flash-lite | 3.9s | 2.1s | 1.9× |
| claude-haiku-4.5 | 4.0s | 2.2s | 1.9× |
| qwen-3.6-flash | 4.8s | 1.6s | 3.1× |
| gpt-5.4-nano | 5.0s | 1.5s | 3.4× |
Start boundaries are consistently ~2× harder than end boundaries across all models. This makes intuitive sense: sponsor segments often begin with a natural transition ("speaking of which..."), while endings are marked by clearer signals ("anyway, back to..."). The prompt instructs models to start 2–3 seconds before the transition phrase and include music gaps — this ambiguity makes start detection inherently noisier.
> Cost-Performance Frontier
For a production service processing thousands of videos daily, cost per video is a critical dimension. The spread across models is dramatic — about an 11.7× cost difference between the cheapest and most expensive model.
> Cost vs F1
Cost-performance Pareto frontier. Top-left corner is the sweet spot.
> Cost per Video
API cost for a single video analysis, sorted cheapest first.
> Latency
Response time in seconds. Solid = median, faded = p95.
For an ad-skipping product, the cheapest model is not automatically the best choice. qwen-3.5-flash is the strongest cost-efficiency pick at roughly 557 F1-points per dollar, but gemini-3.1-flash-lite buys a higher overall F1 and stronger recall. In practice, that extra cost may be worth it when missed sponsor blocks are more painful than a small increase in API spend; qwen-3.5-flash is the lean default, while gemini-3.1-flash-lite is the safer quality-first option.
> Limitations
- • Dataset size. 65 videos is enough to surface broad patterns but too small for fine-grained statistical claims. Bootstrap CI widths of ~12–16 pp reflect this — differences smaller than that may be noise.
- • LLM-as-ground-truth. The gold GT itself is produced by AI models, not human annotators. While the multi-model consensus protocol with Krippendorff's α = 0.857 suggests high internal reliability, systematic biases shared by all reference models would be invisible.
- • Single-pass evaluation. Each model runs once per video at temperature 0.3 with a uniform reasoning budget (1024 thinking tokens) and a 4096-token output cap. No ensembling or multi-pass aggregation is used.
- • Pricing volatility. API costs are based on published rates at time of evaluation and may change.